I thought i'd pop on to do one last update before I head to Doncaster to commence the Christmas celebrations (which, as i'm sure you'll already know, will involved copious amounts of pinot AND Baileys-it is Christmas after all). This past week or so has been a whirlwind-Himself has returned from what feels like outerspace and I've had no trouble at all integrating him back into the domestic routine of housework and childcare-bless him, he's still walking around looking rather dazed. Despite our reservations the children have welcomed him back with arms open-so open in fact that they refuse to leave him alone and are constantly biding for his attention. Really consuming for him but absolutely great for me-I can have a shower without a little head bobbing round the curtain or without the contents of the wash basket being dumped at the end of the bath, causing me to jump around in panic, inevitably getting shampoo in my eyes and having to the spend the rest of the day bleary eyed as if i'm looking through fog.
Anyway-so he's back, the kids have attended all of their xmas parties, done both nativity play and carol concert and all the shopping is done, and I found some great Mr Kiplings mince pies in the coop which was buy one get one free, which leaves me time to study!! I have actually been cracking on with TMA02 and have done the majority of the methods questions and about 400 words of the essay. I hate writing essays, I feel like i'm always letting myself down-I KNOW what the answer is but I just can't get it down on paper how it sounds in my head!
This week's study includes chapter two of the research methods book, chapter one of the SPSS book, study week 10 of the workbook and Audio 4 (which I will admit to not listening to yet, I am going to take it in the car for the journey down 'south'). I found this week quite interesting actually and despite moaning I actually found I enjoyed the SPSS part, although I am confident that it's going to get a lot more complicated before the end of the course! The research methods book was fairly straight forward, and that's what i'm going to look at today....
CORRELATION: A way of 'investigating relationships between two or more variables'. Working out a correlation is a way of using quantitative data to generate general laws. the data used are often either material (ie hormones, things we can physically measure) or behavioural (pretty obvious really). Looking at information this way helps us to come to a 'cause and effect statement'-the cause of one variable of the effect on another variable. We can predict (or hypothesize) on the effect of one variable on another.
We could say, for example, if I give my three year old 2 tubes of smarties, her behaviour will become more erratic and hyperactive (than normal). We can test this theory by taking a group of 10 three year olds and giving them each smarties-the first one has one tube, the second has two and so on (there are obvious ethical considerations here and I would not recommend that you carry this out). You could then also measure the amount of household objects broken between the administration of the smarties and the time when the child passes out exhausted in a heap. The data can then be shown on a scatterplot.

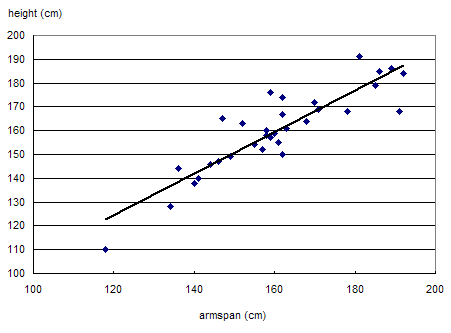
Now, lets assume that our prediction was correct-the more smarties consumed, the more items broken. If you replace the label on the x-axis (the horizontal line) with amount or smarties consumed and the label on the y-axis (the vertical line) with amount of items broken-this is what our scatterplot would (in a round about way) look like. we can see that there is a relationship between the two variables by the way the pattern of dots slopes upwards.
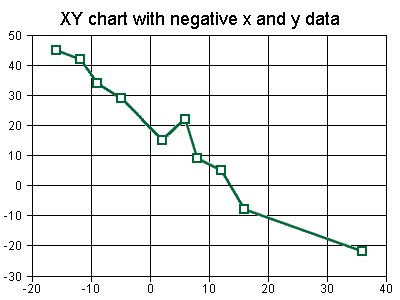
No lets talk about correlation coefficients. This is a mathematical expression of how variables are related and range from -1 to +1. A positive correlation means that as one variable increases so to does the other one (or as one decreases, so does the other one). The fictional results of our smarties test shows a positive correlation-as one variable increases (amount of smarties) so to does the other variable (amount of items broken). On a scatterplot, this would be illustrated like on the scatterplot above, with a line sloping upwards from left to right. The correlation coefficient of a positive correlation would be a number between 0-1. 1 would be a positive correlation, and as the number gets lower the correlation is said to be less strong. A negative correlation is the opposite-as one variable increases the other variable decreases (or vice versa). On a scatterplot, the pattern would slope from top left to bottom right:

The correlation coefficient here is between 0 - -1. Likewise, the closer to -1 the number, the stronger the relationship is said to be. A coefficient of 0 means that there is no correlation.
However, coefficients can only tell us the relationship presented by the data, it does not determine that one variable is in fact the cause of the effect on the other variable-it might be down to other variables, or it might be coincidence.
The next section of the chapter looks at experiments. Generally in experiments, whether carried out in a lab or a more natural setting, the researcher attempts to manipulate a variable to see what effect this has on another variable and measures the outcome. By controlling this the researcher is irradicating anything else that may have an effect as much as possible (the difference between correlation and experiments is the control-correlations are used when the variables cannot be controlled). In order to manipulate the variables, the researcher could provide a certain list of words to be remembered, or could change the amount of smarties given. Changing one thing at a time and measuring the effect would give us a better idea of which one contributes to the effect.
I have to leave it there as we're off to buy wrapping paper! I shall be back later....

No comments:
Post a Comment